85,351 Unique Visitors
185,700 In-Person Visits
168 Countries
Top 20: Visitors by Country
| 1 | Spain | 32.94% |
| 2 | UK | 8.52% |
| 3 | Germany | 6.87% |
| 4 | France | 5.08% |
| 5 | Italy | 4.85% |
| 6 | China | 4.44% |
| 7 | USA | 3.34% |
| 8 | Netherlands | 3.24% |
| 9 | Belgium | 2.04% |
| 10 | Poland | 1.58% |
| 11 | Switzerland | 1.48% |
| 12 | Portugal | 1.36% |
| 13 | Sweden | 1.26% |
| 14 | Denmark | 1.13% |
| 15 | Norway | 1.06% |
| 16 | Austria | 0.92% |
| 17 | Czech Republic | 0.88% |
| 18 | South Korea | 0.84% |
| 19 | United Arab Emirates | 0.84% |
| 20 | Turkey | 0.81% |
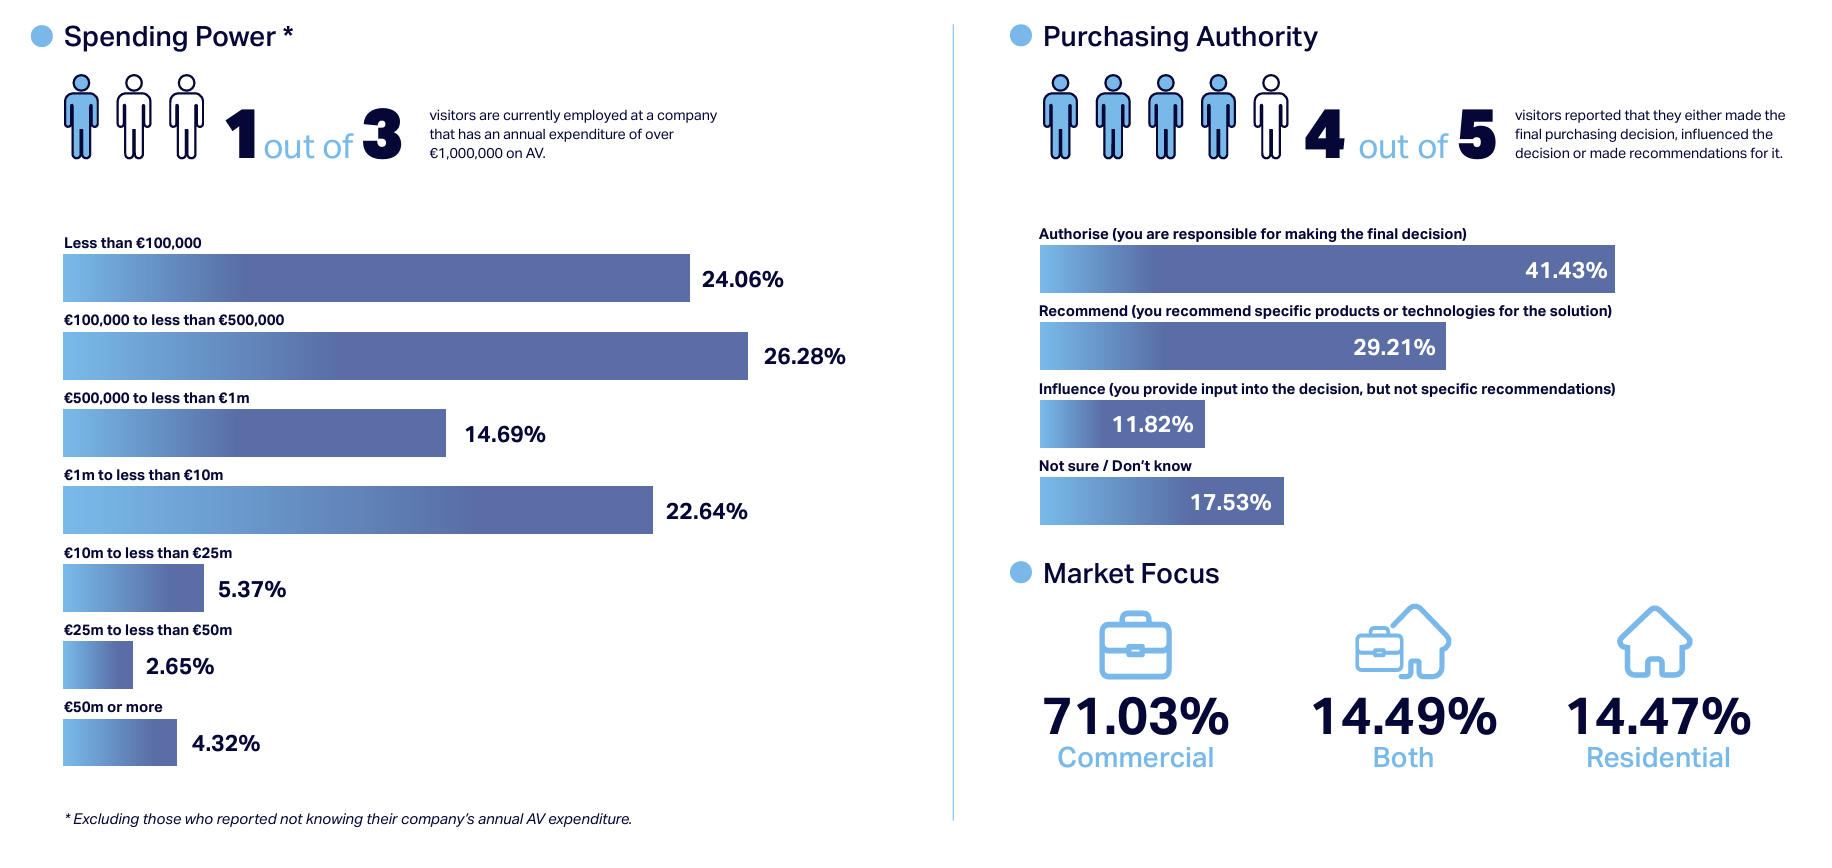
Spending Power, Purchasing Authority and Market Focus
Business Focus - AV Channel and End-User
AV Channel Definition
ISE defines all attendees either as belonging to the AV channel or as end-users. Attendees who stated that they sell or recommend AV solutions to a customer are classified as belonging to the AV channel. AV channel visitors totalled 44,307, which is 71.60% of the visitor figure (61,882). Of these 44,307 AV channel visitors, 18,974 (42.82%) were visiting ISE for the first time.
Top 10 Markets Served by Channel Attendees
| Sector |
% |
| Auditoriums / Theatres / Entertainment Venues | 39.20% |
| Corporate Offices / Collaboration Spaces | 39.20% |
| Retail sales floor / Kiosks | 30.43% |
| Classrooms or Learning Spaces | 28.26% |
| Stadiums or Sports Arenas | 27.93% |
| Museums / Themed attractions | 27.02% |
| Restaurants/ Dining Facilities | 26.61% |
| Audio / video production rooms for broadcast | 26.26% |
| Waiting areas / lobbies | 20.69% |
| Control rooms for monitoring production, output, or security | 19.53% |
End-User Definition
Attendees who stated that they were looking for AV solutions for use within their own company are classified as end-users. End-user visitors numbered 17,574, which is 28.40% of the visitor total. (The corresponding figure at ISE 2024 was 15,877.) Of these 17,574 end-users, 9,827 (55.91%) were visiting ISE for the first time.
Top 10 Markets Served by End-User Attendees
| Technology |
% |
| Auditoriums / Theatres / Entertainment Venues | 34.59% |
| Audio / Video Production Rooms for Broadcast | 27.12% |
| Corporate offices / Collaboration Spaces | 23.50% |
| Classrooms or Learning Spaces | 20.29% |
| Stadiums or Sports Arenas | 15.08% |
| Museums / Themed Attractions | 12.06% |
| Retail Sales Floor / Kiosks | 11.46% |
| Control Rooms for Monitoring, Production, Output or Security | 11.03% |
| Waiting Areas / Lobbies | 9.83% |
| Restaurants / Dining Facilities9 | 9.37% |
)
)
)
)
)
)
.png/fit-in/500x500/filters:no_upscale())
)
)
)
)
)
)
)
)
)
)
)
)
)
)